Customer Churn Analysis
Analyzed 50K e-commerce customer records to uncover churn drivers, then built a risk-scoring model and Tableau dashboard that identified $6.9M in recoverable revenue.
Segmented customers into risk tiers so retention efforts could target the 730 highest-value accounts likely to churn, instead of every customer equally.
Problem
High customer churn was eroding revenue, but the business lacked visibility into which customers were at risk and why — making retention efforts broad and ineffective.
Solution
We built a behavioral segmentation model and an interactive Tableau dashboard that classified customers by churn risk tier and surfaced the patterns driving attrition.
Outcome
Delivered a segmentation model and interactive dashboard surfacing high-risk customers by behavior tier, enabling targeted retention campaigns across global markets.
Type
Data Analytics
Role
Data Analyst
Timeline
2025
Problem
Correlation vs. actual prediction
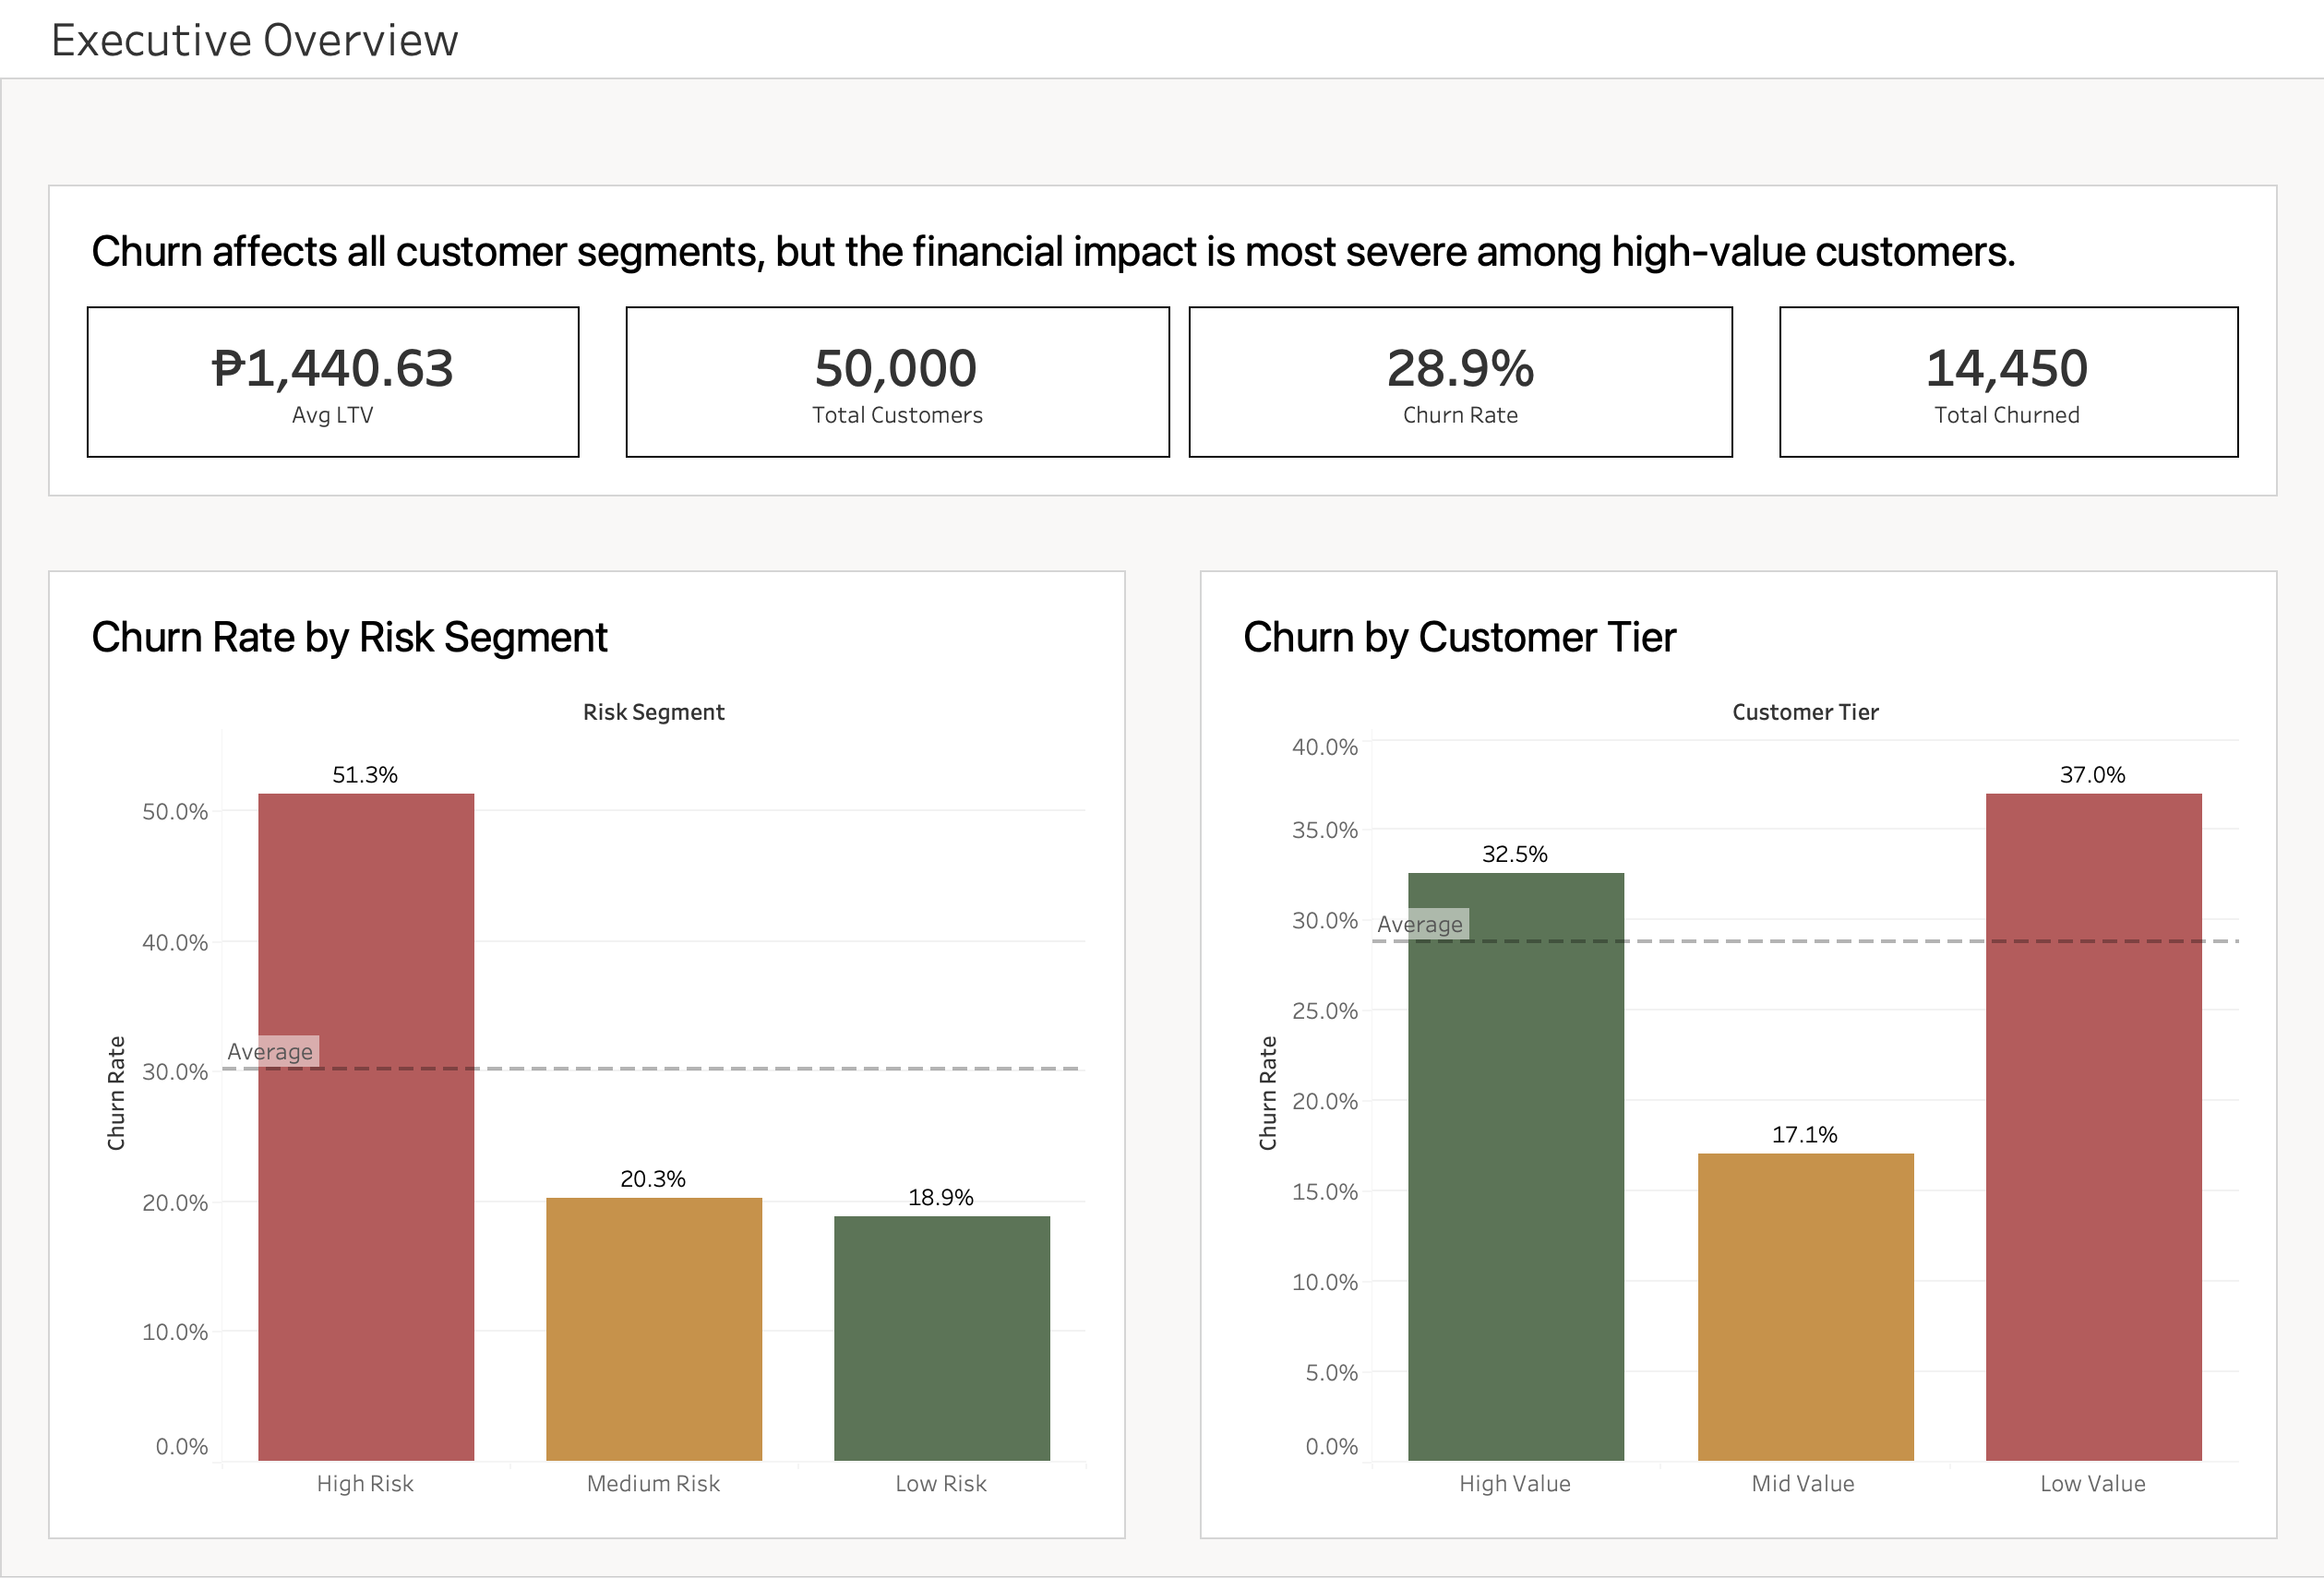
Churn was already known: 28.9% of customers, $20.5M in lost lifetime value. What wasn't known was which customers were about to leave, or which factors actually predicted it rather than just correlated with it by coincidence.
What the analysis needed to find: which behavioral signals reliably predict churn, and can they be turned into a segmentation model precise enough to prioritize a retention budget?
Method
Dataset overview and cleanup
50,000 customer records, 25 behavioral, transactional, and demographic features, spanning 8 countries and 4 signup cohorts (Q1 through Q4).
Before analysis, the dataset needed real cleanup: nearly 49,000 missing values scattered across columns, an age field topping out at 200, and negative purchase amounts. Each issue got a documented rule rather than a blanket drop, since missingness wasn't random and dropping rows would have quietly skewed the churn rate itself.
Ruling out geography and time
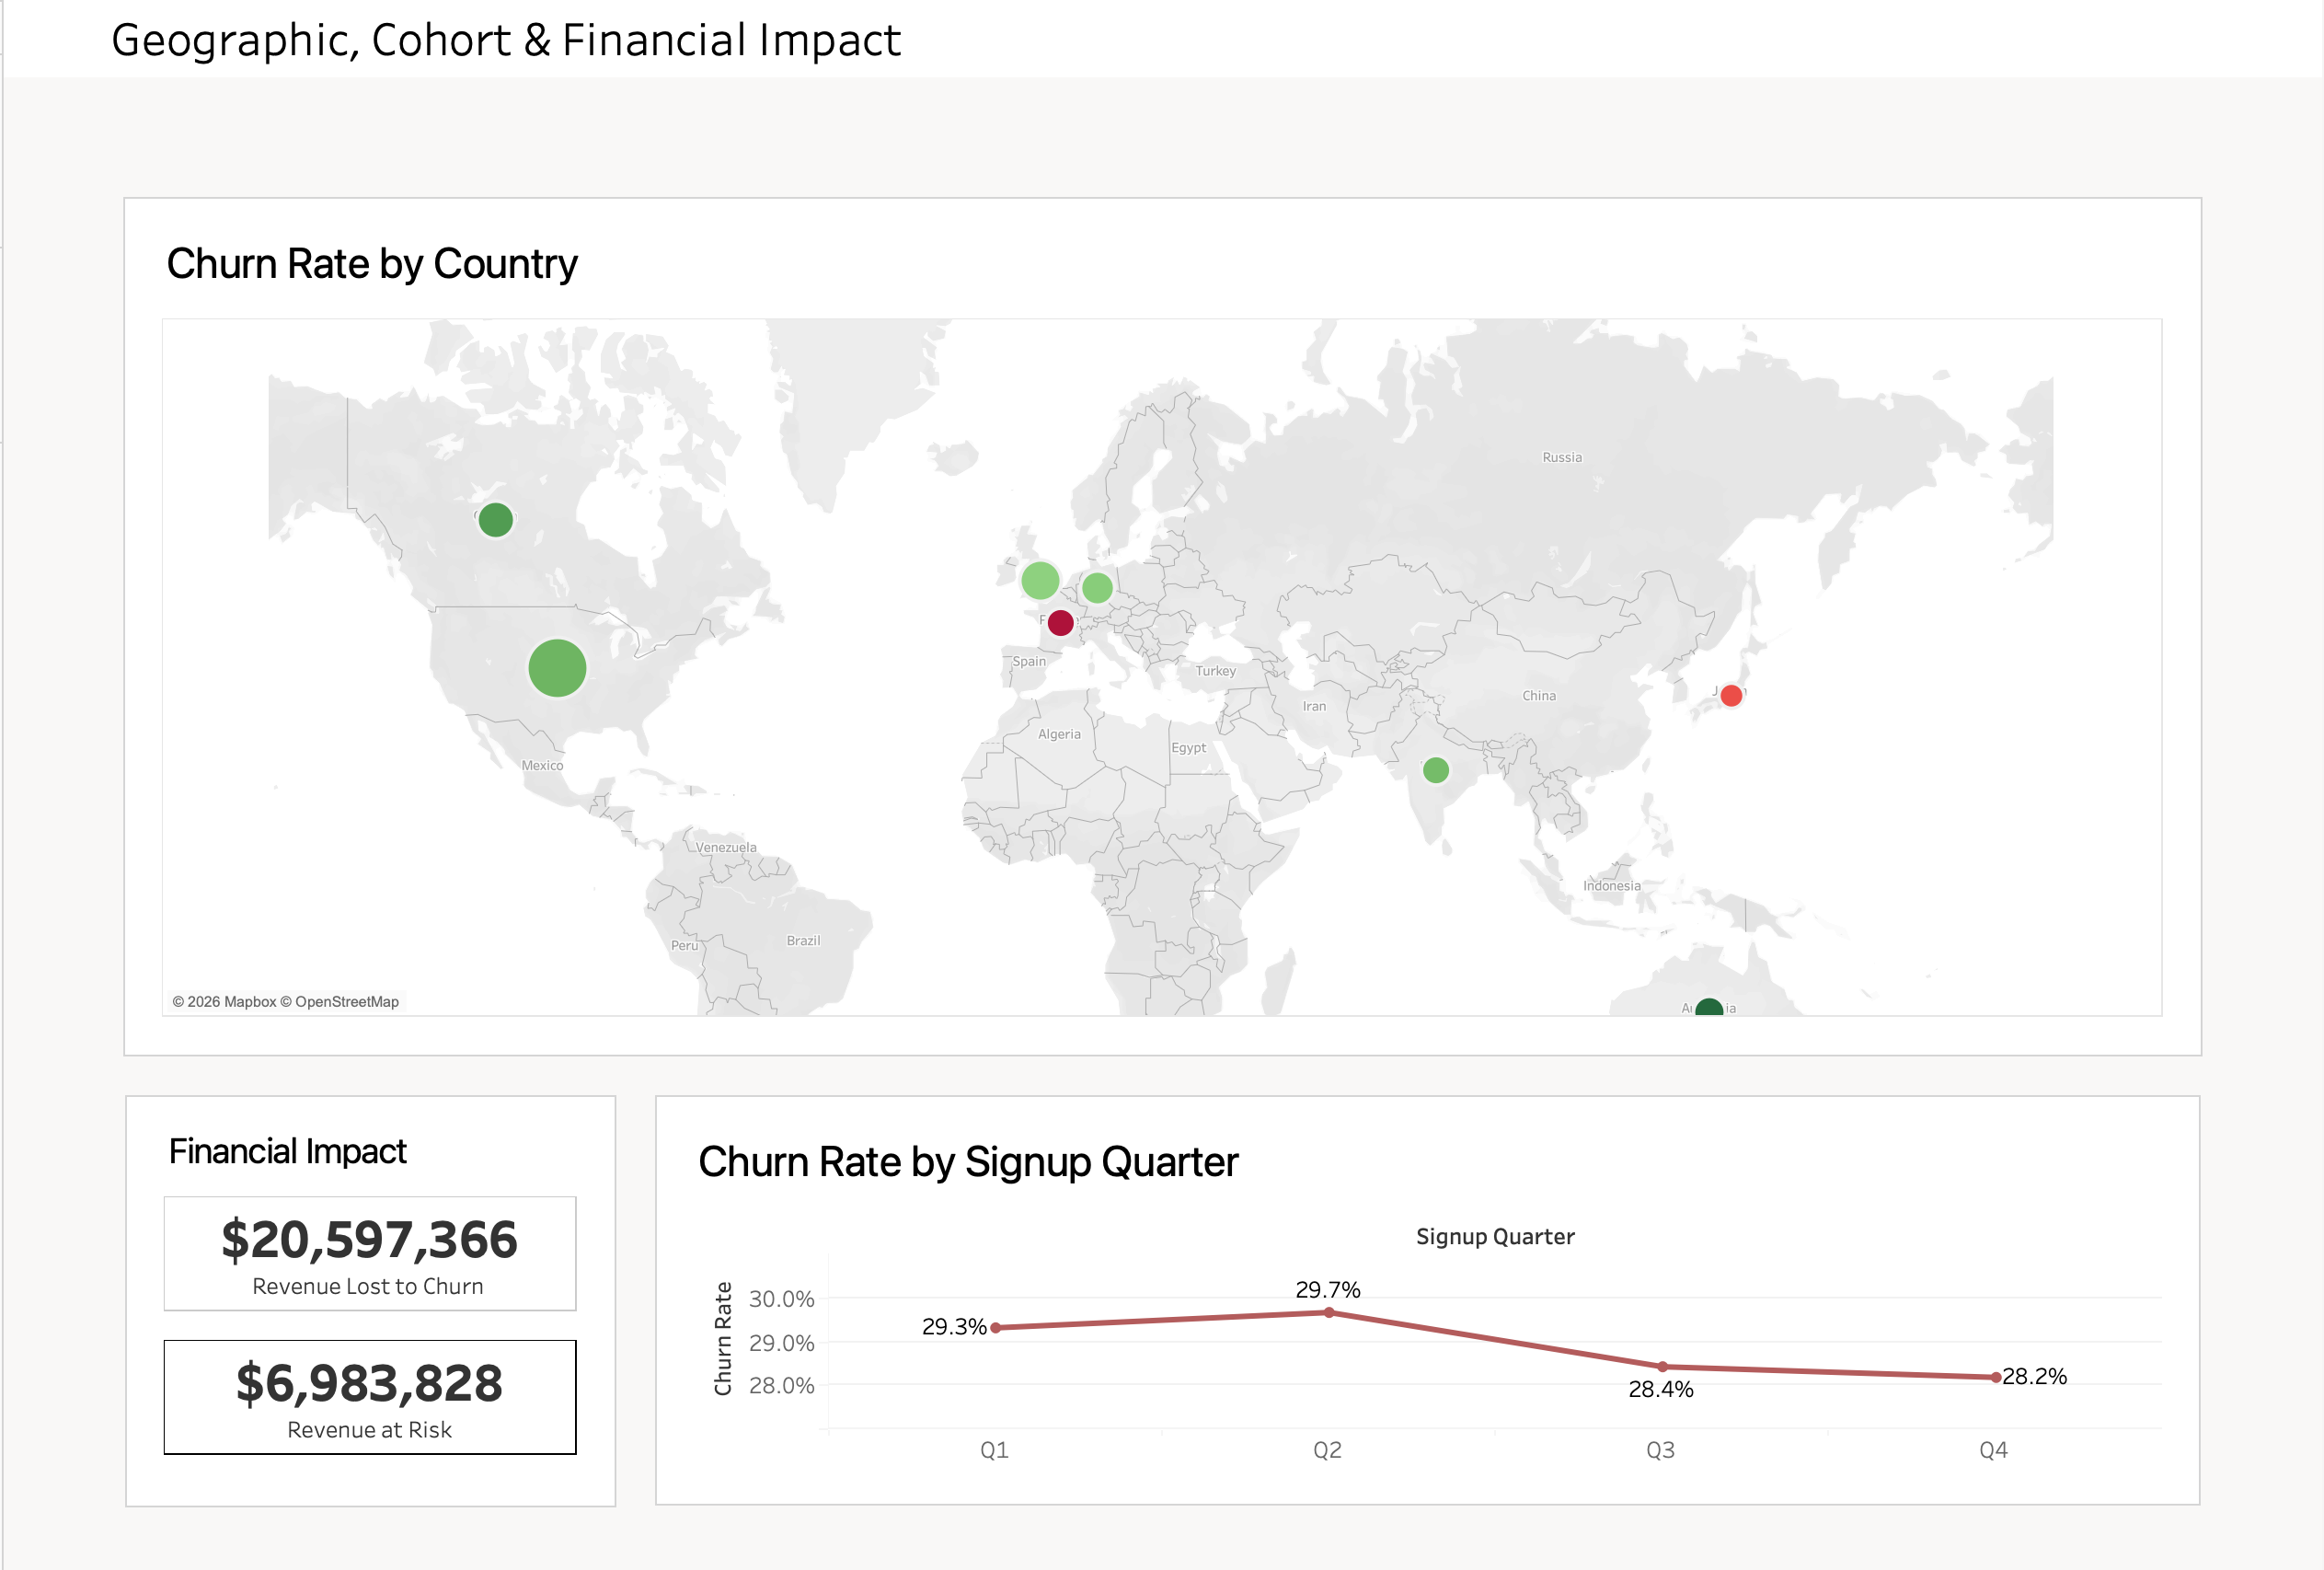
Churn held at 27–30% across every one of the 8 countries and every signup quarter. Customers with 3+ years of tenure churned at about the same rate (29%) as new signups. A regional, seasonal, or loyalty problem would have shown up as variation here — it didn't, so those were ruled out.
Looking at behavior instead
Three engineered features carried the signal: cart abandonment rate, engagement score (a weighted composite of login frequency, session duration, and wishlist activity, normalized 0–1), and purchase recency (days since last purchase).
Building the risk segments
These three features fed a rule-based Risk Segment (Low, Medium, High), cross-tabulated against Customer Tier (Low, Mid, High Value, by lifetime-value percentile), then validated in PostgreSQL across three joined tables (customers, engagement_metrics, churn_summary) with eight analysis queries.
SELECT c.customer_id, c.country, c.customer_tier, e.risk_segment, ROUND(c.lifetime_value::NUMERIC, 2) AS lifetime_value, ROUND(e.engagement_score::NUMERIC, 4) AS engagement_score, ROUND(e.cart_abandonment_rate::NUMERIC, 4) AS cart_abandonment_rate, c.days_since_last_purchaseFROM customers cJOIN engagement_metrics e ON c.customer_id = e.customer_idWHERE c.customer_tier = 'High Value' AND e.risk_segment = 'High Risk' AND c.churned = 0ORDER BY c.lifetime_value DESCLIMIT 20Findings
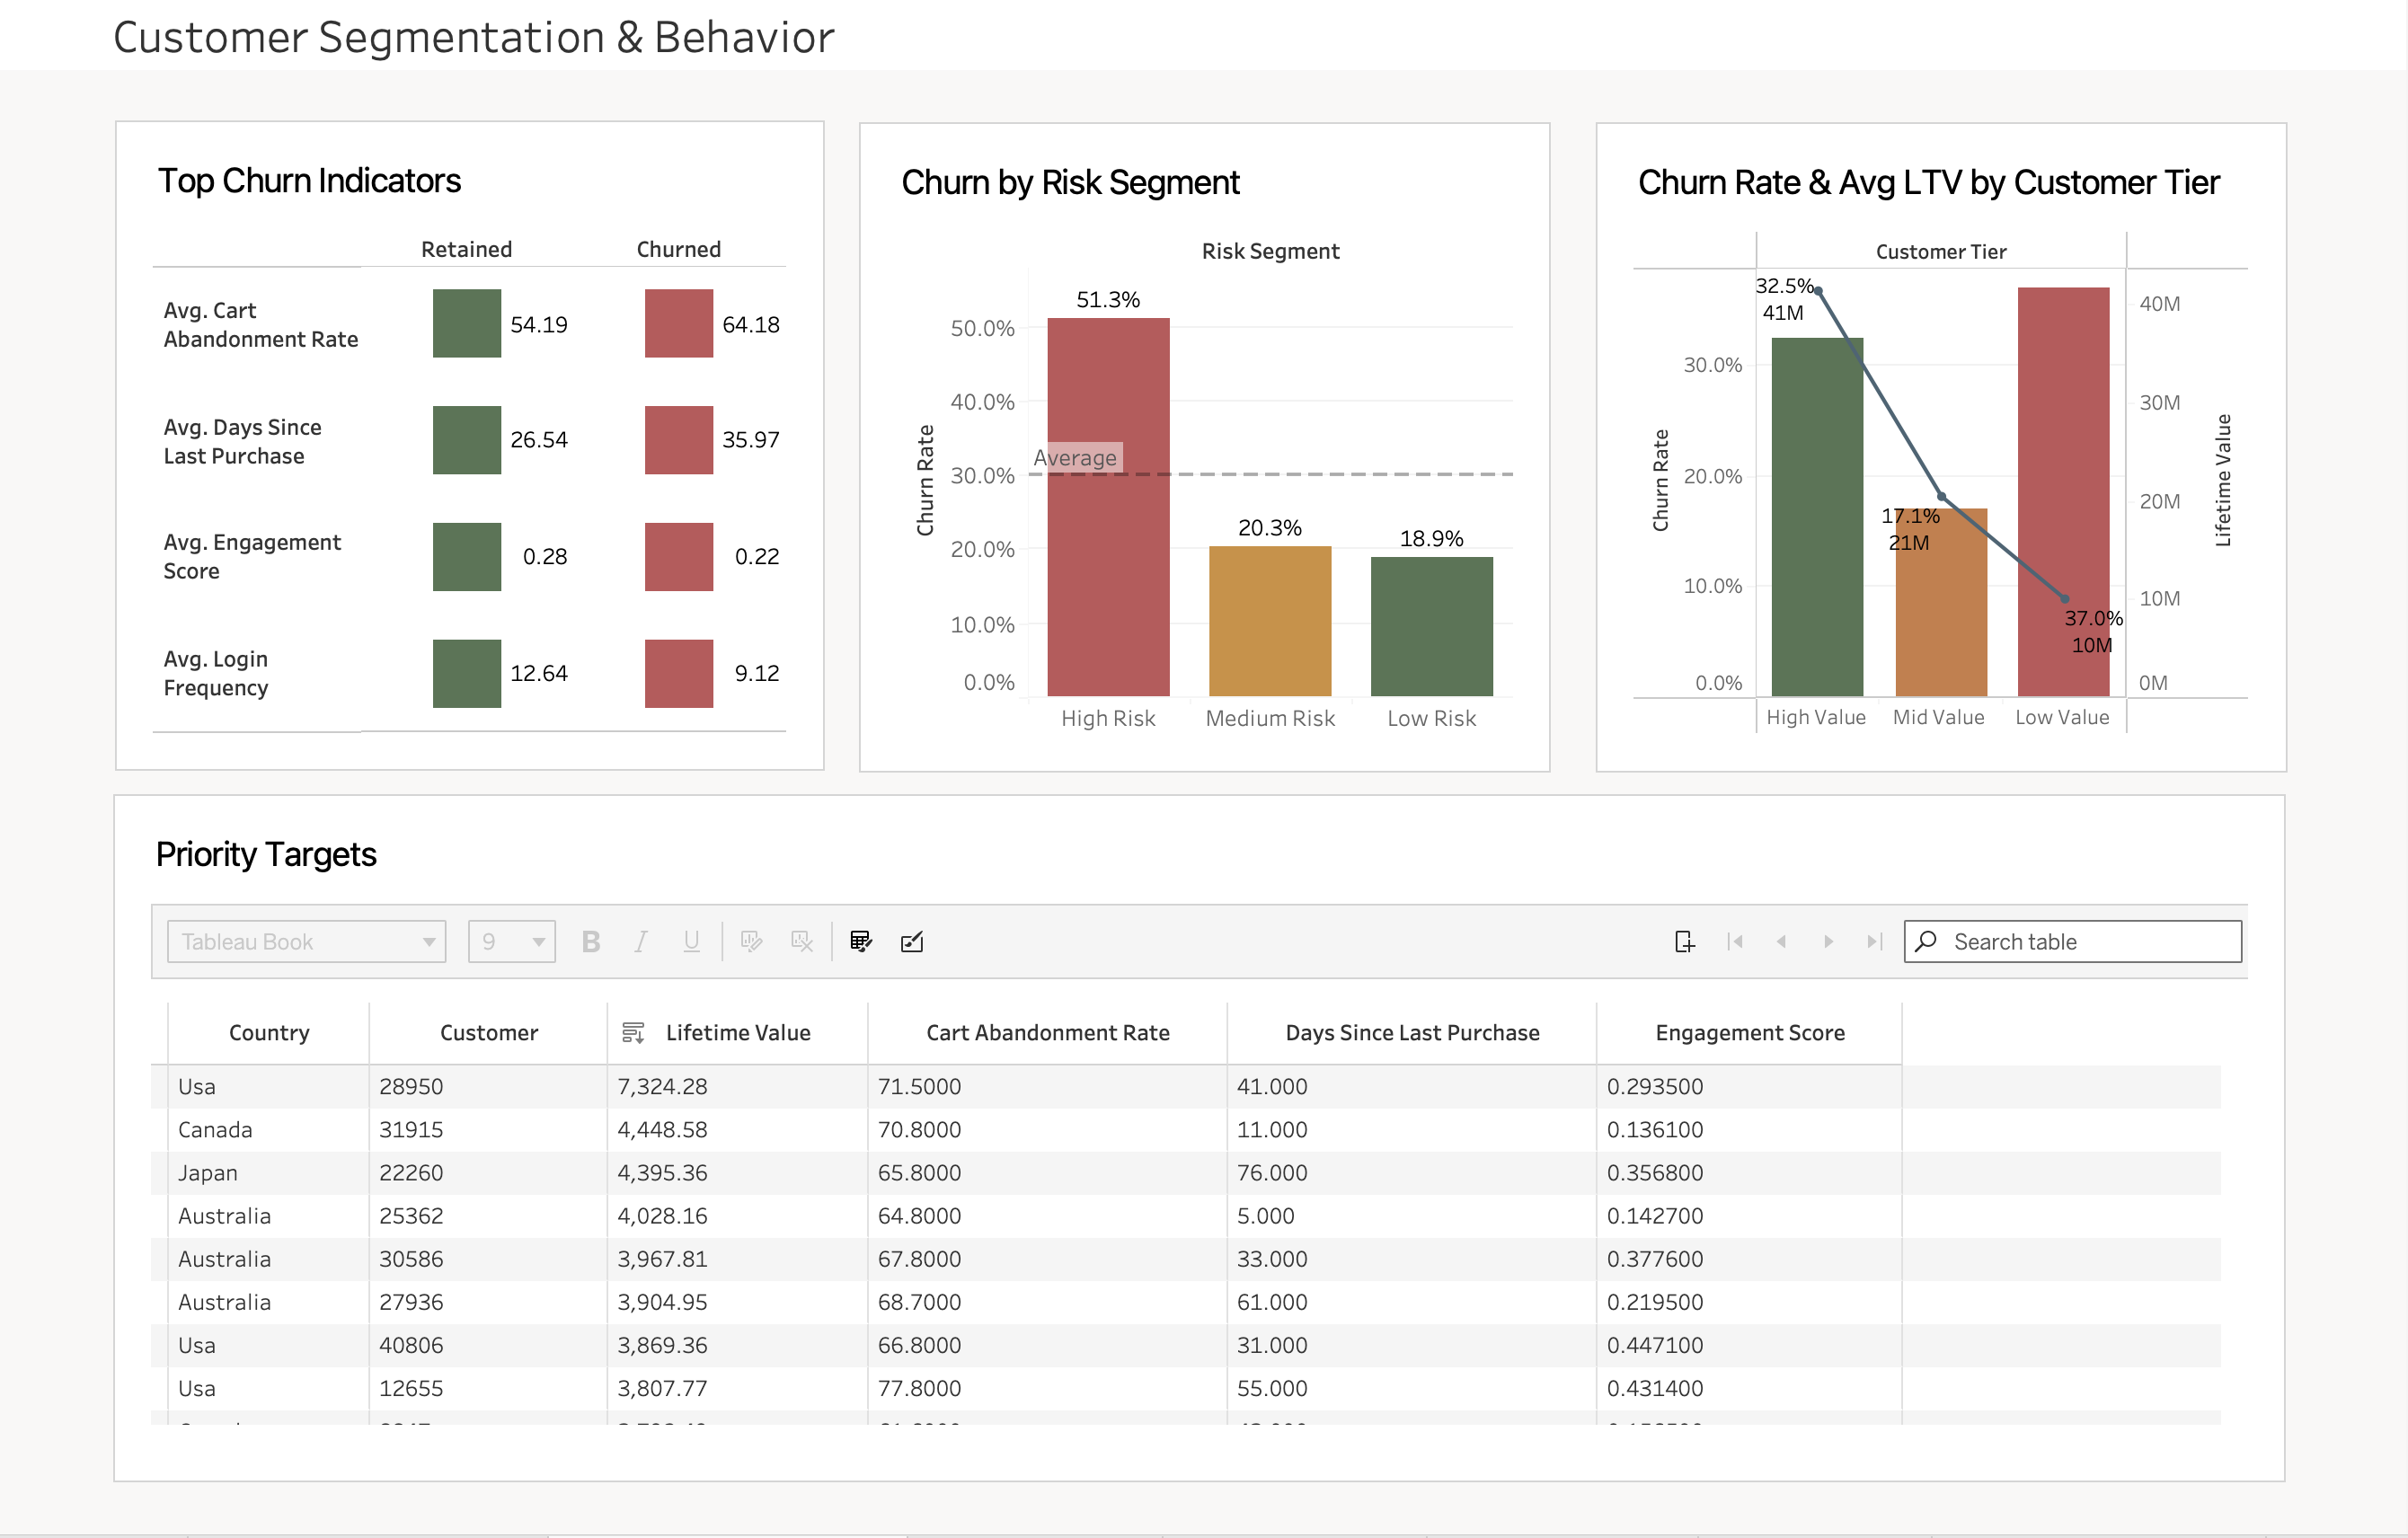
Cart abandonment: 64.2% for churned customers vs. 54.2% for retained, the single strongest behavioral gap in the dataset.
Engagement score: 0.22 for churned customers vs. 0.28 for retained, a smaller gap than cart abandonment but still consistent with disengagement.
High Risk customers churn at 51.3%, nearly 3x Low Risk customers (18.9%), confirming the segmentation separates real risk, not noise.
High Value customers aren't protected: they churn at 32.5%, despite carrying an average lifetime value of $2,437, above the overall customer average.
730 High Value, High Risk customers haven't churned yet, representing $6.9M in revenue still recoverable.
# Engagement Score: weighted composite, login frequency matters mostengagement_scaled = MinMaxScaler().fit_transform(df[['Login_Frequency', 'Session_Duration_Avg', 'Wishlist_Items']].fillna(0))df['Engagement_Score'] = (0.4 * engagement_scaled[:, 0] + 0.35 * engagement_scaled[:, 1] + 0.25 * engagement_scaled[:, 2]).round(4) # Risk Score: 3 binary flags on cart abandonment, engagement, and recencydf['Cart_Risk'] = (df['Cart_Abandonment_Rate'] > df['Cart_Abandonment_Rate'].quantile(0.66)).astype(int)df['Engagement_Risk'] = (df['Engagement_Score'] < df['Engagement_Score'].quantile(0.33)).astype(int)df['Recency_Risk'] = (df['Days_Since_Last_Purchase'] > df['Days_Since_Last_Purchase'].quantile(0.66)).astype(int)df['Risk_Score'] = df['Cart_Risk'] + df['Engagement_Risk'] + df['Recency_Risk'] def assign_risk(score): if score >= 2: return 'High Risk' elif score == 1: return 'Medium Risk' else: return 'Low Risk' df['Risk_Segment'] = df['Risk_Score'].apply(assign_risk)Recommendations
Five prioritized actions, each sized against the data.
Cart abandonment recovery campaign, targeting the 730 High Value + High Risk accounts first, an estimated $178K–$267K in preserved revenue from that segment alone.
Re-engagement outreach triggered by an engagement-score or login-frequency drop, intervening before a customer decides to leave rather than after.
Loyalty program redesign around engagement instead of tenure, since membership length currently has zero effect on retention (28–29% churn across every tenure bucket).
Mobile checkout audit, since High Risk customers abandon carts at 72.5%, consistent with a friction problem rather than a price or demand problem.
Live version of the risk-scoring model, run monthly against the full customer base, shifting retention from reactive to proactive.
Limitations and Next Steps
The dataset is a snapshot, not a live feed, so the risk model needs to be re-run monthly to stay accurate. It also has no campaign cost data, so the ROI estimates lean on industry-standard conversion benchmarks rather than this business's actual numbers.
Correlation isn't causation, either: cart abandonment predicts churn, but the dataset can't say why customers are abandoning carts. The natural next step is a controlled test, holding an intervention against a control group of High Risk customers, to move from "this predicts churn" to "this fixes it."
Takeaways
Missing data isn't random, so it can't be treated like it is. Nearly 49,000 values were missing across columns, handled by column-specific rules (impute, cap, or drop) instead of a blanket drop, since dropping rows uniformly would have skewed the churn rate itself.
Tenure being a non-factor was more useful than if it had worked. The assumption was that loyalty programs reduce churn over time. They don't: membership length had zero effect, about 29% churn whether a customer joined last month or three years ago.
Outliers can be a data quality signal, not just noise. An age value of 200 and negative purchase amounts weren't just rows to clean, they pointed to upstream data issues worth flagging back to whoever owns that pipeline.
Project Links
| Project Links | Link |
|---|---|
| GitHub Repository | github.com ↗ |
| Executive Overview | public.tableau.com ↗ |
| Customer Segmentation & Behavior | public.tableau.com ↗ |
| Geographic, Cohort & Financial Impact | public.tableau.com ↗ |
Stack
 Python
 Pandas
 PostgreSQL
 Scikit-learn
 Tableau